Table Visualization: Bar chart of current sorted value
...
|
Table Visualization Interface |
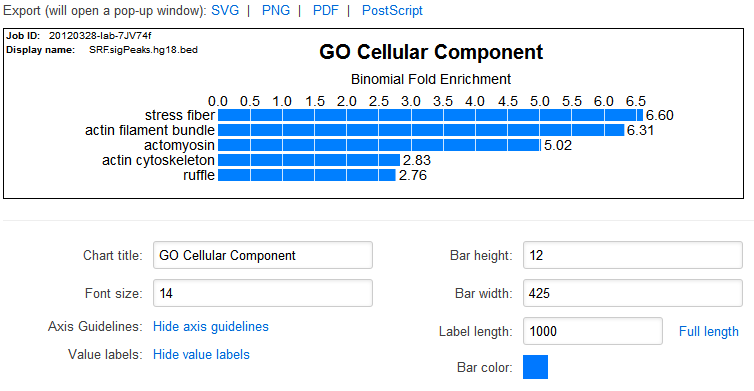
What?
The "bar chart" will plot a single statistic for the visible terms in the table. The plotted statistic is the one by which the table is currently sorted.
...
Ontology Visualizer: Visualize shown terms in hierarchy
|
...
Table Visualization Interface |
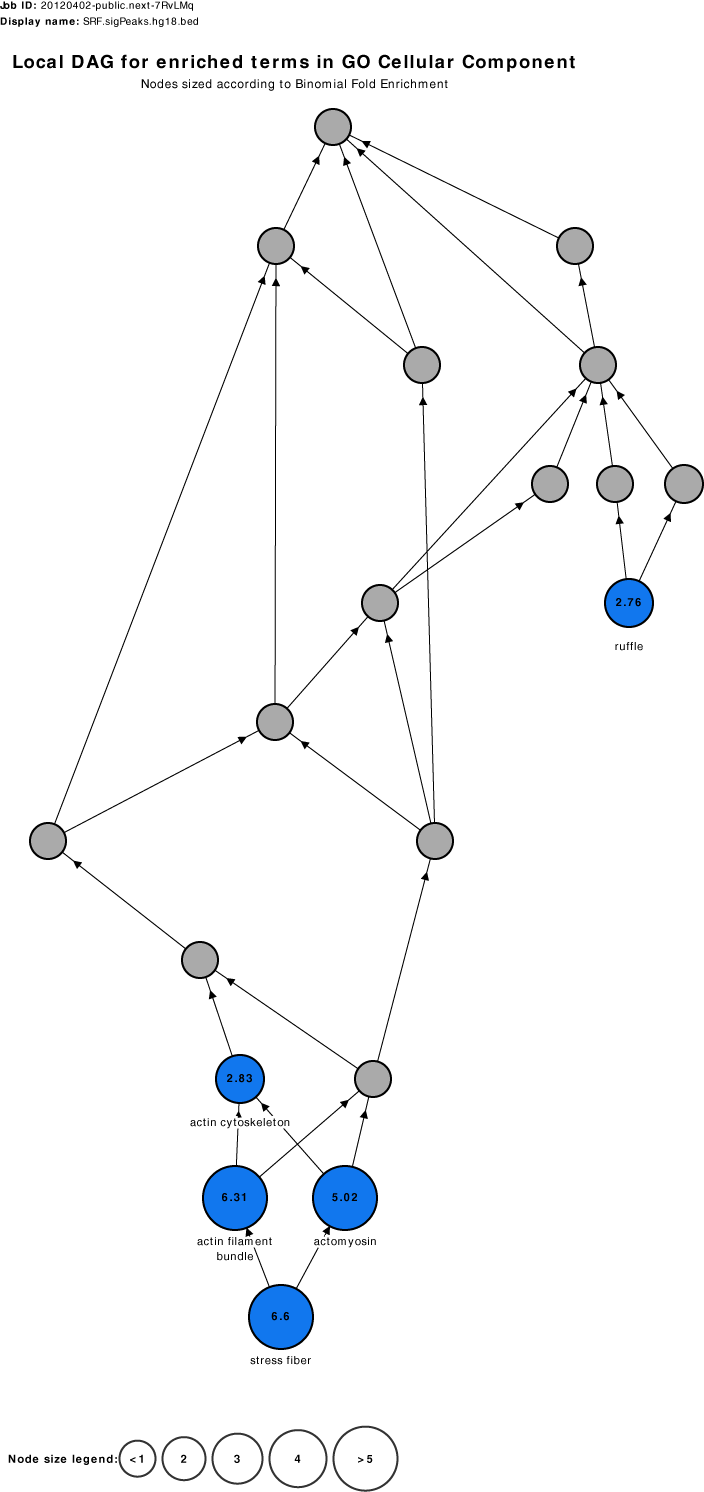
What?
Visualize the terms that are currently visible in the table (blue) and all their parents (gray). The size indicates the fold enrichment of the term.
...