Statistics
- Former user (Deleted)
- Erich Weiler
- Former user (Deleted)
When GREAT runs against a whole genome background, it calculates two measures of enrichment: one using a binomial test over genomic regions and one using a hypergeometric test over genes. When GREAT runs against an explicit background set of genomic regions, it calculates a single enrichment value using a foreground/background hypergeometric test over genomic regions.
Whole Genome Background
Why does GREAT perform two statistical tests - the binomial test and the hypergeometric test?
GREAT performs both the binomial test over genomic regions and the hypergeometric test over genes to provide an accurate picture of annotation enrichments for genomic regions. Each test has a bias that is compensated by the other test.
Biases
- The hypergeometric test is potentially biased by the differing sizes of gene regulatory domains. Genes in gene deserts are more likely to be chosen simply because deserts provide large regions where the gene is the nearest one. Thus, the annotation terms of genes in deserts tend to show enrichments even in random sets of genomic regions.
- The binomial test is potentially biased by a large number of genomic regions being associated with a small set of genes. If many regions repeatedly tag the same genes, then the terms applied to those genes show enrichment.
Compensation
- The binomial test overcomes the bias of the hypergeometric test by explicitly accounting for the sizes of the regulatory domains of genes.
- The hypergeometric test overcomes the bias of the binomial test by counting each gene only once. Thus, it does not repeatedly tag a gene or set of genes.
What is the binomial test formally?
The binomial test is a statistical test calculated for a set of genomic regions. In this test, every annotation is ascribed a probability that a randomly placed genomic region is assigned the annotation. This probability is the fraction of the genome over which a genomic region is associated to a gene with the annotation. Thus, it accounts for the varying sizes of the regulatory domains of genes. Formally:
- Let G be the size of the genome in base pairs.
- Let g? be the portion of the genome in the regulatory domain of a gene with annotation ?.
- p? = g? / G
- Let n be the number of test genomic regions.
- Let k? be the number of test genomic regions in the regulatory domain of a gene with annotation ?.
The binomial p-value equals the probability of having k? or more of the n test genomic regions in the regulatory domain of a gene with annotation ? given that the probability of that occurring for a single genomic region is p?.
Binomial P-value = 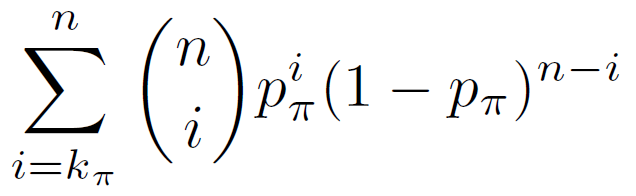
What is the hypergeometric test formally?
The hypergeometric test is the standard gene enrichment test applied by tools such as DAVID. It is a statistical test calculated for a set of genes. In this test, a gene is included in the test set if a test genomic region is associated with the gene. The hypergeometric test specifies whether this test gene set is enriched for any annotations out of the full set of genes in the genome. It is applied independently for every annotation ?. Formally:
- Let N be the number of genes in the genome.
- Let n be the number of genes in the test gene set.
- Let K? be the number of genes in the genome with annotation ?.
- Let k? be the number of genes in the test gene set with annotation ?.
The hypergeometric p-value equals the probability of choosing k? or more genes with annotation ? when randomly drawing n genes from the genome.
Hypergeometric P-value = 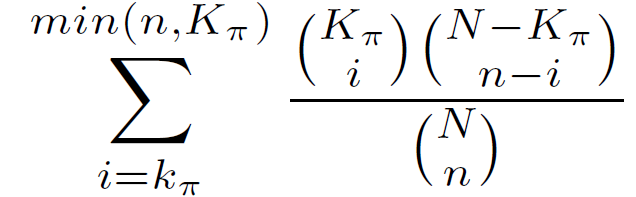
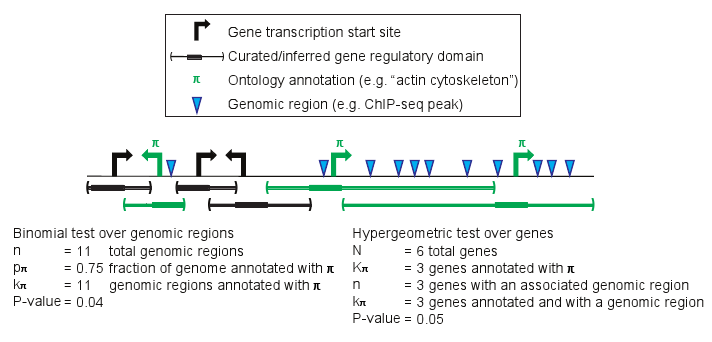
Example
Explicit Background Set
If you provide an explicit background set, GREAT uses a different statistical test than for a whole genome background, a foreground/background hypergeometric test over genomic regions. Unlike the similarly-named hypergeometric test over genes used with a whole genome background, it is not biased by the differing sizes of the regulatory domains of genes.
What is the foreground/background test formally?
The foreground/background hypergeometric test is a statistical test calculated for a set of genomic regions. It specifies whether a foreground (test) set of genomic regions is enriched for any annotations out of the full set of background genomic regions. The foreground genomic regions are specified in the test set, and the background genomic regions are specified in the background set. All foreground regions must be present in the background set. Formally:
- Let N be the number of genomic regions in the background set.
- Let n be the number of genomic regions in the foreground set.
- Let K? be the number of genomic regions in the background set in the regulatory domain of a gene with annotation ?.
- Let k? be the number of genomic regions in the foreground set in the regulatory domain of a gene with annotation ?.
The hypergeometric statistic equals the probability of choosing k? or more genomic regions with annotation ? when randomly drawing n genomic regions from the background set.
Hypergeometric P-value =
How should I interpret the statistics provided by GREAT? Which test is more important - the binomial or the hypergeometric?
GREAT calculates numerous statistics to guide the framing of novel hypotheses about the test set. Different statistics offer different perspectives on the data, allowing different types of potential hypotheses to be examined.
By default, GREAT ranks results by the binomial p-value, and we consider this the single best way to examine genome-wide cis-regulatory datasets. It accounts for biases in gene regulatory domain size and provides an accurate picture of the cis-regulatory landscape. Still, it is important to examine other statistics too:
- Binomial fold enrichment (observed / expected) offers an alternative ranking that occasionally highlights different terms than the binomial p-value, often favoring more specific terms deeper in the ontology structure.
- Binomial set coverage (the fraction of all genomic regions in the test set that lie in the regulatory domain of a gene with the annotation) provides a sense of functional coherency of the test set. A high set coverage for a given annotation suggests that most test regions shares the listed function. Alternatively, the test set may contain multiple different coherent subsets.
- Hypergeometric observed genes (number of genes in the test set with the annotation) and hypergeometric p-value show whether the highlighted subset of regions congregates around few or many different genes.
- Hypergeometric term coverage (fraction of all genes with the annotation that gets tagged by the test set) is useful in highlighting smaller groups of genes which can not facilitate extreme p-values. Yet, a high coverage of such a set can still be biologically revealing (e.g., covering most members of a certain pathway).
How does GREAT perform multiple hypothesis test correction?
When testing a family of hypotheses simultaneously, the likelihood of incorrectly rejecting the null hypothesis for at least one member of the family increases. To correct for this, a multiple hypothesis test correction is often applied.
GREAT offers two multiple hypothesis test corrections for testing m hypotheses at a significance threshold of ?:
Bonferroni correction
The Bonferroni correction is a conservative multiple hypothesis test correction. It requires a raw p-value of ?/m for significance.
The Bonferroni corrected p-value displayed by GREAT equals (m * raw p-value).
False discovery rate (FDR) correction
The false discovery rate correction enables control of the expected number of incorrect rejections of the null hypothesis. To perform the FDR correction, the hypotheses are ranked in decreasing order of p-value (from 1...k...m). Then the largest k is found such that the kth p-value < k?/m. The first k terms are considered significant.
The FDR q-value displayed by GREAT equals (m * raw p-value / k). Note that the q-values are not necessarily monotonically increasing (the q-value for the (k+1)th best raw p-value can be smaller than the q-value for the kth best raw p-value due to the division by rank k). Consequently, a q-value above the significance threshold can be significant if a later q-value satisfies the significance criteria (e.g. if the q-value for the 5th best raw p-value is 0.06 but the q-value for the 10th best raw p-value is 0.04, then all of the top ten terms are significant at a 0.05 level).
What is the term annotation count?
An important factor in multiple hypothesis test correction is the number of hypotheses tested, m. In practice, however, many of the annotation terms ("hypotheses") are applied to very few genes in the genome and have little chance of satisfying significance thresholds (even if your set tags every one of the genes with the annotation). These "extra" annotation terms place a higher burden on the other hypotheses in multiple hypothesis test correction.
The minimum (maximum) term annotation count is the smallest (largest) number of genes in the genome to which an annotation must be applied for consideration. So, if you set the minimum term annotation count to 5, then only annotations that are applied to at least five genes in the genome will be tested. This decreases the number of hypotheses tested and provides a fairer m for multiple hypothesis test correction of the other hypotheses.
Numerical Precision
Since GREAT's results are obtained using floating point arithmetic it has limitations imposed on the amount of precision it can output. Occasionally, the output p-values will be 0 since the lowest pvalue that GREAT can return is 1E-324. Enrichments more significant than this will show a pvalue of 0.